Computing a tunnel volume from scan data in MicroSurvey CAD 2016 or newer
MicroSurvey CAD’s modeling routines are usually limited to “top down” data which does not contain vertical faces and overhangs. But in many cases you can accommodate this limitation by creating a “top half” surface and a “bottom half” surface.
In this article we’ll go over the steps of calculating a tunnel volume from data that was collected using a Leica Nova MS50.
- Preparation Settings
- Configuring a Slice
- Generate points for Bottom
- Generate points for Top
- Creating Bottom and Top Surfaces
- Building the TINs
- Inspecting your Surfaces
- Generate a Volume Report
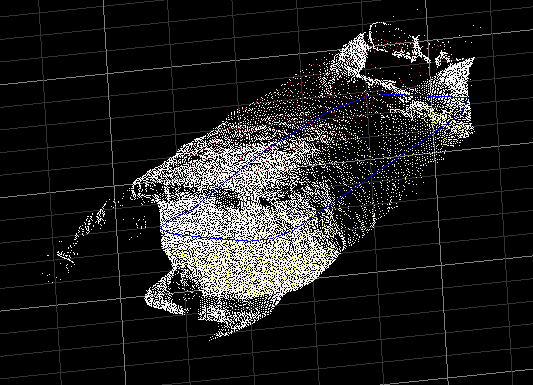
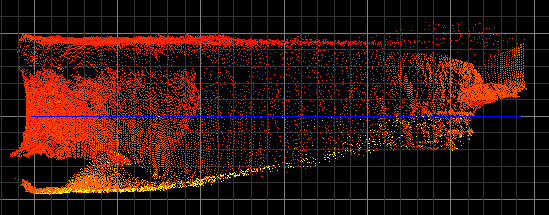
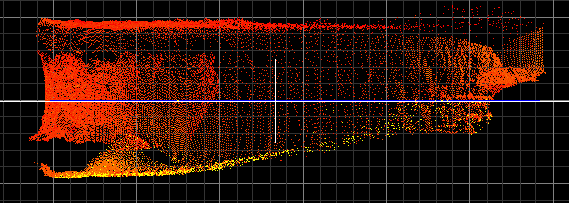
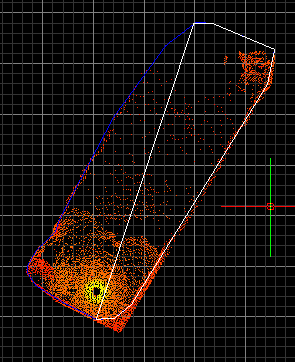
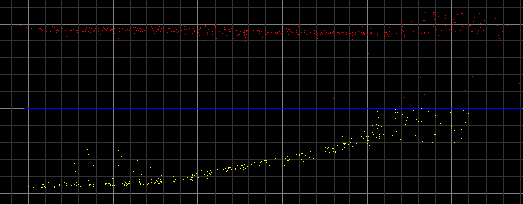
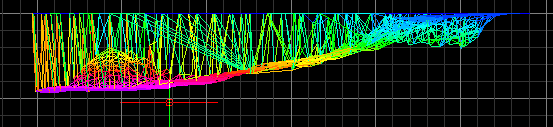
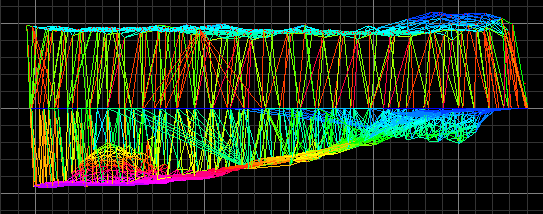
An advantage of the MS50 controlled by either FieldGenius or Leica field software is that you can generate linework as well as scan data while performing your fieldwork. In this sample data set you can see that a scan was performed from within a tunnel, and care was taken to survey points and a breakline at the widest point of the tunnel, to help define the top and bottom halves of this volume:
Be sure to configure your AutoMap to draw this breakline as a 3D polyline when the project is imported.
Preparation Settings
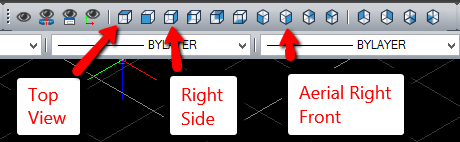
- To make it easy to switch your viewing perspective I recommend adding the View toolbar and the MsLayer toobar to your workspace by right clicking on a toolbar and adding from the menu that appears:
The View toolbar:
...and the MsLayer toolbar:

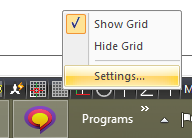
- Open your Grid Settings menu:
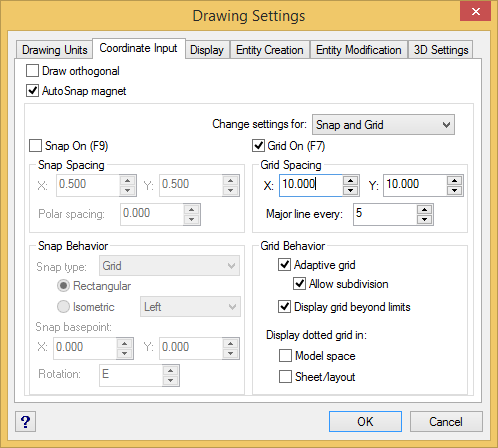
Configure as shown:
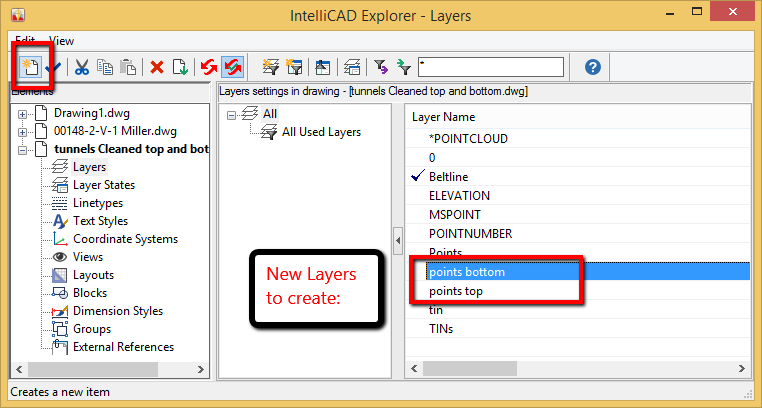
- Create two new layers in IntelliCAD Explorer:
Configuring a Slice
We need to subdivide our tunnel scan data so that only the bottom half appears.
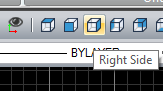
- Pick the Right Side View:
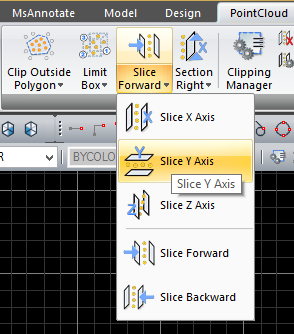
- Switch to your PointCloud ribbon tab and select Slice Y Axis from the Clipping group:
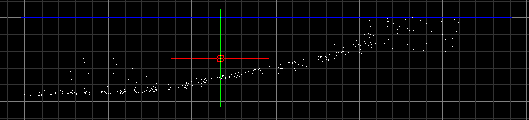
- Click once at the mid-point line:
- Click once below your lowest point:
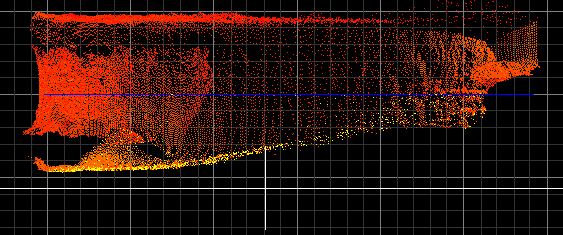
- The Result:
Generating points to define the bottom half of the tunnel
- Switch to Top View:
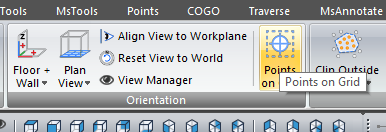
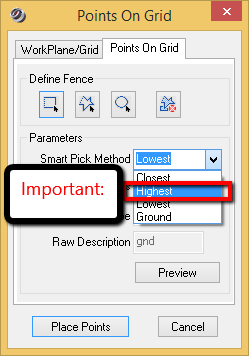
- Activate Points on Grid from the Orientation group:
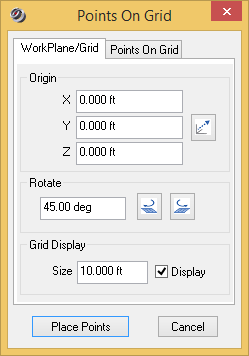
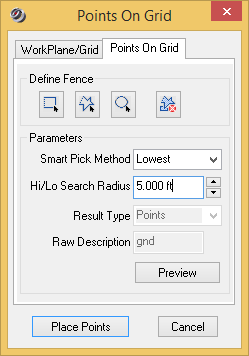
- In this case we will sample data in a 10 by 10 grid, with a search radius set to find the lowest point 5 feet from each grid vertex. Your values may vary depending on the density of data, cleanliness of data, and overall size of the data set.
Configure as shown:
- Define a polyline fence:
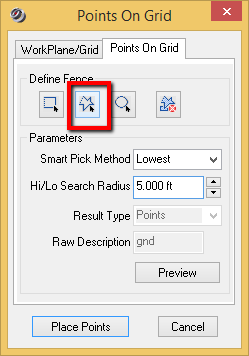
…and follow the mid-point polyline:
- Hit Enter when complete.
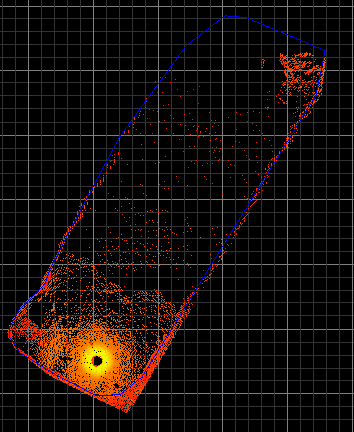
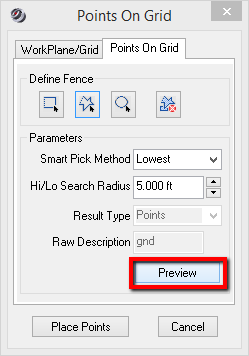
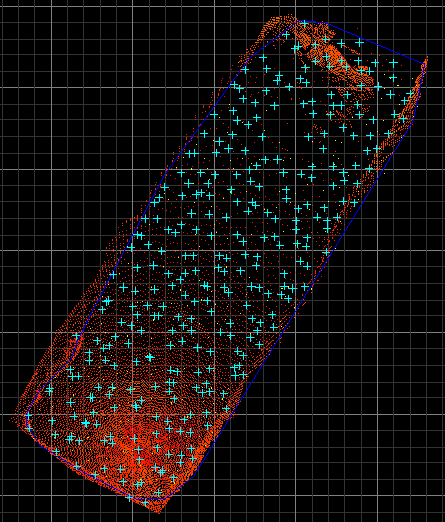
- Select Preview to see the result of your configuration, and revise the grid size or search radius if you would like to increase or decrease the density:
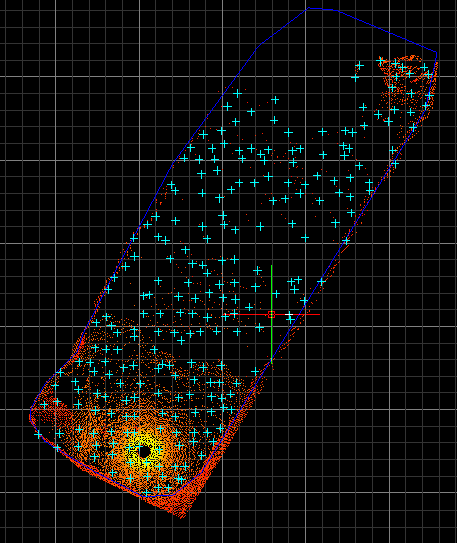
- Your preview should look similar to the one shown below:
- Switch to the Workplane panel and Place Points when you are satisfied:
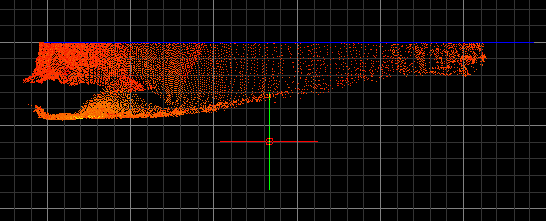
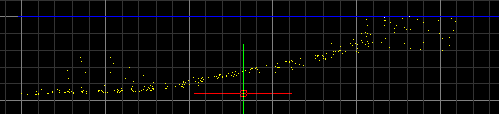
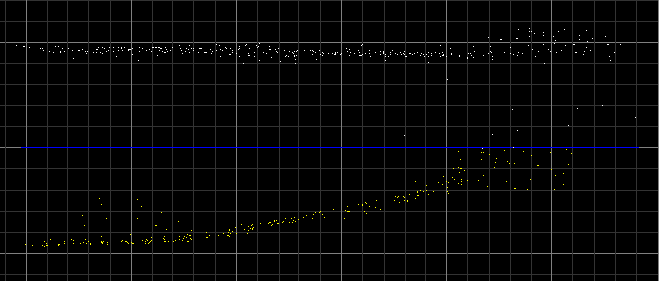
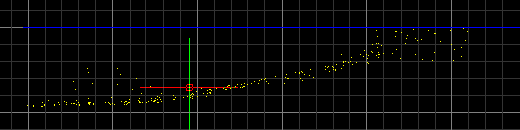
- Switch to Right Side and toggle off the Point Cloud to see the results:
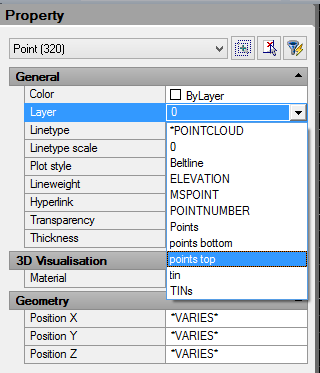
- Window in all your new points:
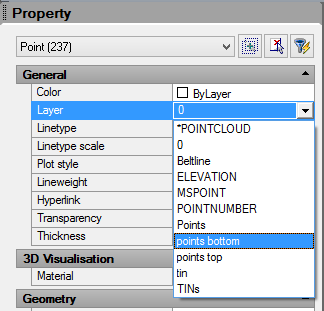
…and in the Properties dialog switch them to the Points bottom layer:
Generating points to define the top half of the tunnel
- Modify the slice so that we can isolate points above the mid-point line.
Toggle on the Point Cloud:
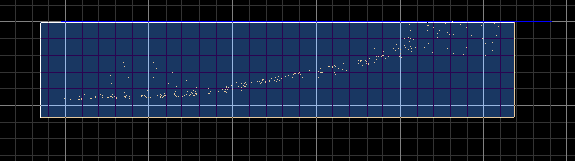
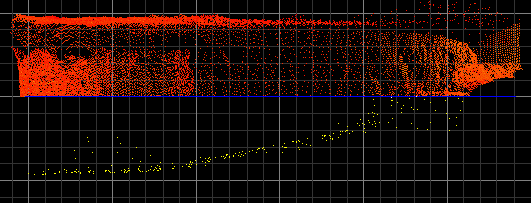
- Slice Forward:
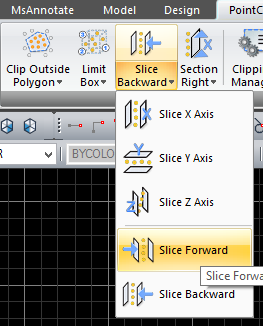
- The Result:
- Repeat the process used to sample points for the lower half of the tunnel.
Top View - Points on Grid, configure as shown:
- Define Polygon Fence that follows mid-point line
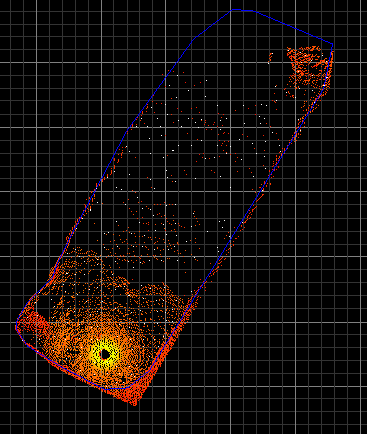
- Preview:
- Place Points
- Toggle off Point Cloud and view Right Side to view the results:
- Change these points to the Points top layer:
- The Result:
Creating Bottom and Top Surfaces
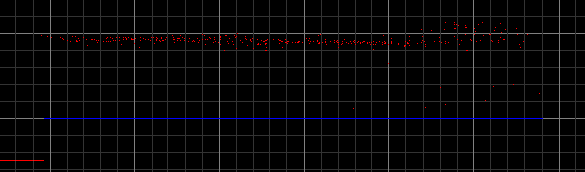
- Isolate your top points and the mid-point line by creating a right-to-left window selection of points and the mid-point polyline:
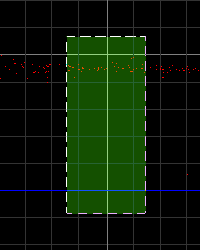
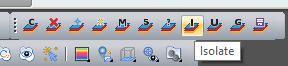
…and picking the Isolate Layer button:
- The Result:
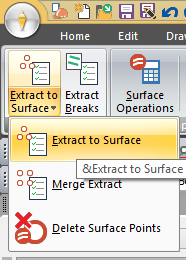
- Switch to the Model ribbon tab, and start Extract to Surface from the Extract group:
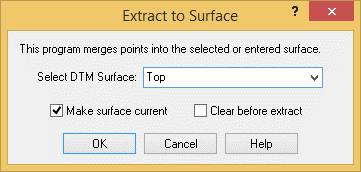
- Create a “Top” surface:
- Select all the isolated entities, and then ENTER to finish. The top surface is now defined.
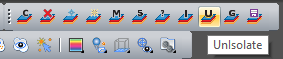
- Unisolate your layers to return them to their previous state:
- Isolate the bottom points and the mid-point line:
- Repeat the process used to create the Top surface to create a new "Bottom" surface using the bottom points and mid-point polyline.
Extract to Surface to create a "BOTTOM" surface:
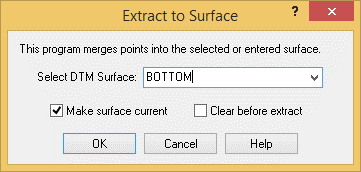
- Select all the isolated entities, and then ENTER to finish. The bottom surface is now defined.
Building the TINs
- Pick “TIN” from the Draw section of your Model menu:
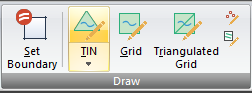
- Enter “S” to specify the Surface:
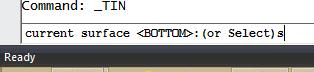
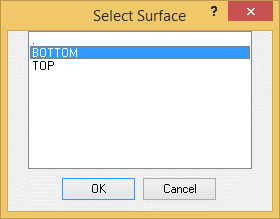
- Pick BOTTOM:
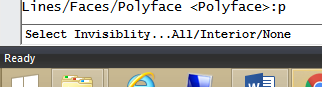
- Watch the command line for prompts and respond as shown:
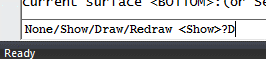
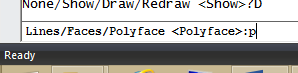
Press ENTER at invisiblity prompt:
- The Result:
- Repeat the process to build the TIN for the TOP surface.
TIN - Enter "S" to specify the Surface, and pick TOP
- Draw the TIN with same prompt responses as for the BOTTOM surface
- The Result:
Inspecting your Surfaces
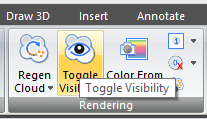
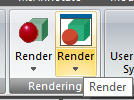
- Switch to the View ribbon tab and pick the second Render option:
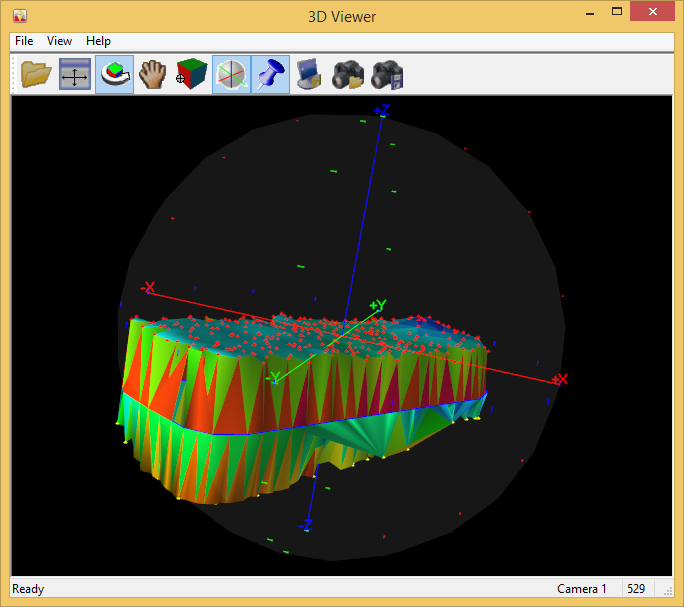
- Use this convenient rendering window to inspect your TIN to ensure it accurately models the top and bottom surfaces:
Save your surfaces as a “QSB” file
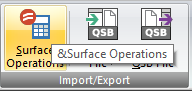
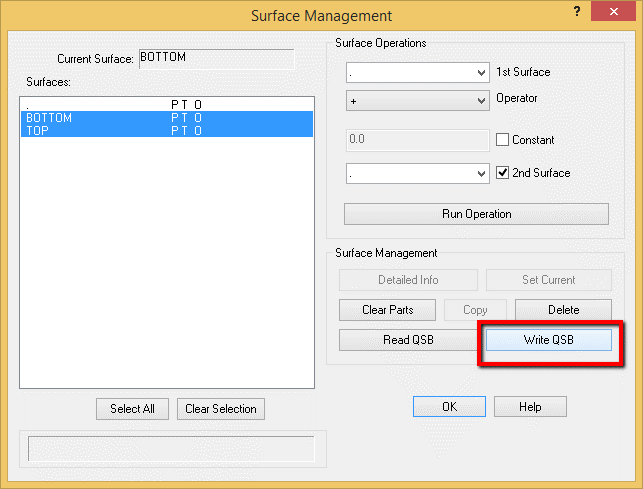
- Switch to the Model ribbon tab and pick the Surface Operations option:
- Select both surfaces and pick "Write QSB":
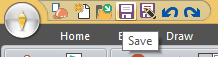
- Save your drawing. At this point the QSB is written and can be reloaded in the future without rebuilding the surfaces.
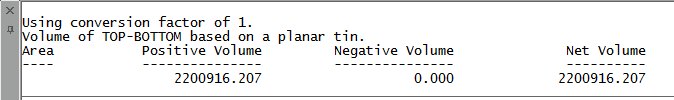
Generate a Volume Report
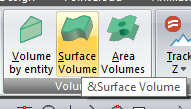
- From the Model ribbon tab, pick Surface Volume:
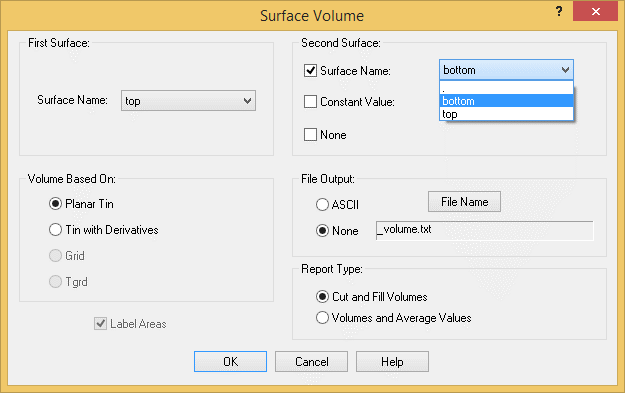
- Configure as shown:
- The Result:
See all the Pointcloud training Movies at this page
James Johnston
Comments