Relative Error Ellipses
Relative Error Ellipses describe uncertainty of one point relative to another point (uncertainty of the line’s coordinate differences, or its distance and azimuth) in a network. Relative error ellipses are computed in STAR*NET when Project Options | Error Propagation | Perform is checked on and a confidence level set.
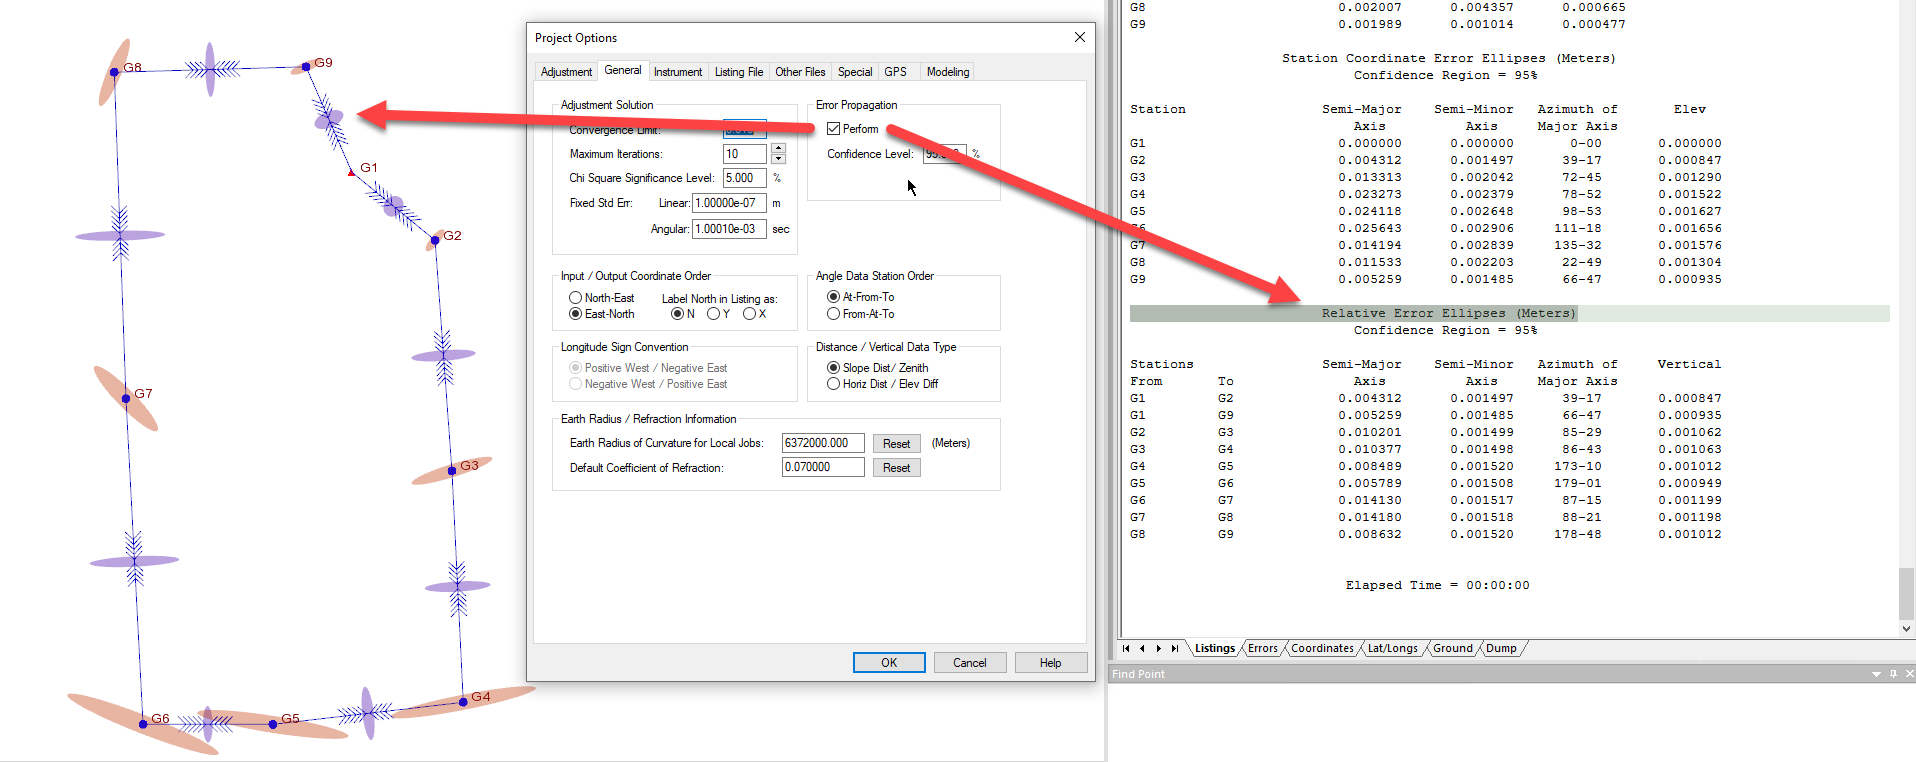
Relative error ellipses are shown in the plot and their dimensions and orientation are listed in the "Error Propagation" section of the listing.
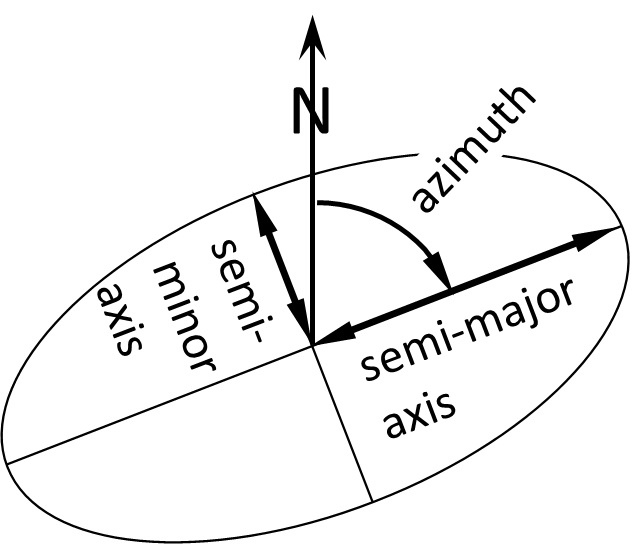
The semi-major axis dimension of an error ellipse is most meaningful to surveyors. It expresses two dimensional uncertainty about a station or connection between stations due to random error. The true value is probably inside the ellipse (at the given confidence level), and most probably at its center. Within the given confidence the true value is expected to be less than the semi-major axis away from the measured value. STAR*NET displays an ellipsoid in the plot which is derived from the dimensions of the ellipse and the vertical uncertainty but this is only apparent when viewing the plot from a three dimensional perspective.
In less technical terms, the semi-major axis expresses the "worst possible case" for the difference between the "true" value and the measured value.
Computation of relative error ellipses between stations NOT connected by measurements can be enabled using either the .REL or the .PTOL inline entries. Please refer to STAR*NET help for guidance.
Testing Relative Error Ellipses against a Standard
An option exists in Project Options | Special |Positional Tolerance Checking that enables testing relative error ellipses against a standard so that you can be alerted when a semi-major ellipse dimension exceeds a minimum standard:
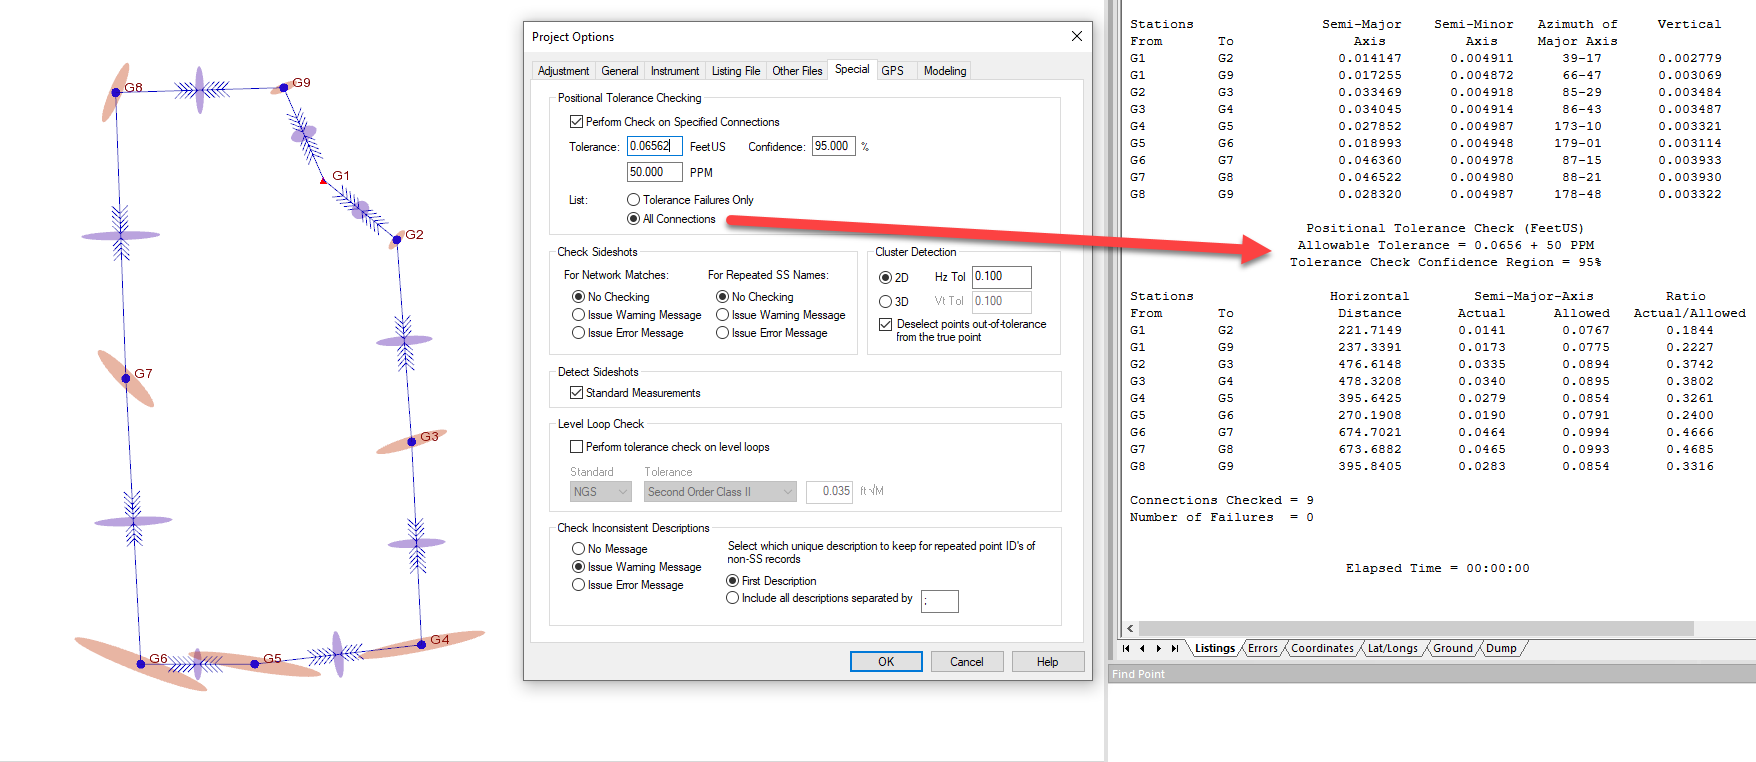
A tolerance standard can be specified by entering a constant, a PPM and a Confidence value.
- Confidence Level = 95% for 95% error ellipses
- Confidence Level = 68% for 68% error ellipses
- Confidence Level = 39% for standard error ellipses
The constant will determine the maximum allowable semi major axis over a distance of zero while the PPM is used to interpolate an additional allowable amount that is derived from the distance between stations. The constant and PPM components combine by simple addition to determine the allowable semi-major axis for a given observation. The Confidence setting will be dictated by the requirements for the type of relative error ellipse to be tested.
There exist various standards that can be applied for tolerance testing. See below for examples from three countries:
________________________________________________________________________________________________________________________________________________
United States
American Land Title Association Positional Tolerance standards are specified as a constant and PPM at a confidence value of 95% and can be entered directly in STAR*NET as shown in the image above. ALTA/NSPS Standards
Apply this standard in STAR*NET by:
- Set project units to feet or us feet
- enable "Perform Check on Specified Connections" in Project Options | Special
- Set "Perform Check on Specified Connections" Confidence value to 95%
- Set Tolerance constant and PPM as specified by ALTA.
- Run an adjustment or pre-analysis and check in the Positional Tolerance Check section of the listing for any error ellipse that exceeds the allowable amount.
________________________________________________________________________________________________________________________________________________
Australia
In Australia the Inter-Governmental Committee on Surveying and Mapping has published a standard for control surveys in the linked document. Standards__Practices_for_Control_Surveys_-_SP1.pdf
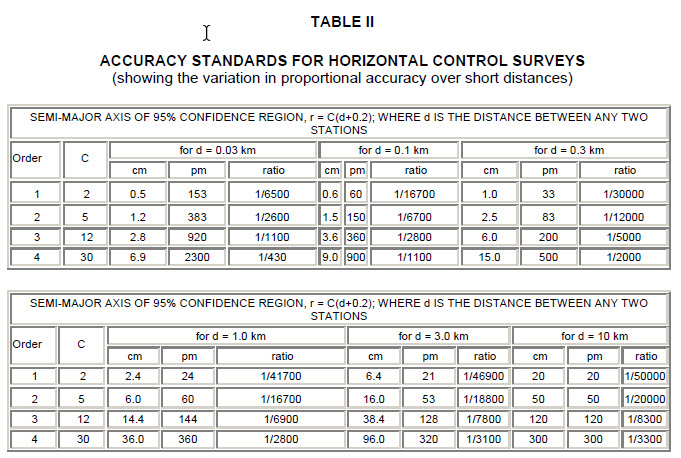
The ICSM directs surveyors to compute the maximum allowable standard error ellipse allowed in a survey using the following formula:
- r = c(d + 0.2)
- where:
- r = the maximum length for the semi major axis in a survey network in millimeters
- c= a value determined by the following table
- d = distance in kilometers
| CLASS | C | Typical applications |
| 3A | 1 | Special high precision surveys |
| 2A | 2 | High precision National geodetic surveys |
| A | 7.5 | National and State geodetic surveys |
| B | 15 | Densification of geodetic survey |
| C | 30 | Survey coordination projects |
| D | 50 | Lower CLASS projects |
| E | 100 | Lower CLASS projects |
Apply this standard in STAR*NET by:
- Set project units to meters
- enable "Perform Check on Specified Connections" in Project Options | Special
- Set "Perform Check on Specified Connections" Confidence value to 39%. *
- Set Tolerance constant and PPM from the table below:
| CLASS | Tolerance (constant) meters | PPM |
| 3A | .0002 | 1 |
| 2A | .0004 | 2 |
| A | .0015 | 7.5 |
| B | .003 | 15 |
| C | .006 | 30 |
| D | .01 | 50 |
| E | .02 | 100 |
5. Run an adjustment or pre-analysis and check in the Positional Tolerance Check section of the listing for any error ellipse that exceeds the allowable amount.
** Note that it is not possible to enter 39% in the General | Error Propagation | Confidence Level so error ellipse dimensions that appear in other sections of the listing and in the plot will differ from the error ellipses being tested in the positional tolerance section of the listing.
________________________________________________________________________________________________________________________________________________
Canada
In Canada Natural Resources Canada has published a standard for control surveys in the linked document. Standards__Practices_for_Control_Surveys_-_SP1.pdf
On Page 15 of the document, surveyors are directed to simulate a proposed network in a computer (or, as we say in STAR*NET, perform a pre-analysis) and apply the r = c(d + 0.2) formula to compute maximum allowable semi-major axes of 95% confidence . A table is provided by NRC which provides C and examples of allowable semi-major axes (in centimeters) in the "cm" column for a variety of distances:
apply this standard in STAR*NET by:
- Set project units to meters
- enable "Perform Check on Specified Connections" in Project Options | Special
- Set "Perform Check on Specified Connections" Confidence value to 95%
- Set Tolerance constant and PPM from the table below:
| Order | Tolerance (constant) meters | PPM |
| 1 | .004 | 20 |
| 2 | .01 | 50 |
| 3 | .024 | 120 |
| 4 | .06 | 300 |
5. Run an adjustment or pre-analysis and check in the Positional Tolerance Check section of the listing for any error ellipse that exceeds the allowable amount.
James Johnston
Comments