Something everybody needs to do is to plot out there drawing to paper. The plot command has many options and settings and sometimes can confuse people so I have explained everything below to try and help you make plotting easy. We can plot to any printer or plotter as long as you have installed the correct drivers in Windows before running the program. This includes older pen plotters, laser printers, inkjet printers and plotters and another other output device that your windows has drivers for.
To start with, the command to plot a drawing is PRINT in MicroSurvey. You can run the print command by typing it at the command prompt, picking the little printer icon in the top left of the screen, or you can pick the print command from the file pulldown menu. They all bring you to the following prompt shown below.

The Print command has 4 different ways to select what you wish to plot. They are shown on the Option Bar just below the command prompt, as shown above.
WINDOW:This method allows you to use the mouse to place a window or box around the location on screen that you wish to plot. You can use Object Snaps to accurately pick locations as required. This allows you to plot either the entire drawing or a portion of the drawing simply by windowing the exact portion desired. If you pick a window larger than the drawing then the blank area selected will also be plotted.
EXTENTS:One of the more common methods of selecting the are to be plotted is to pick the extents of a drawing. This automatically picks everything in the drawing that is available. To see what you will pick you should run Zoom Extents prior to the PRINT command. This command does not plot any blank area around the drawing. If you have a point outside of your desired plotting area then Extents may not be the best way to pick as it will grab that point as well as the rest of the drawing giving you more than required.
VIEW:This will plot exactly what is on screen. This could be a smaller portion of the drawing that you zoomed to. If you zoomed to show the entire drawing and then zoomed back a bit, the portion plotted will include the entire drawing and the blank area around it - exactly what you see on screen.
NVIEW:If you used the VIEW command to save named views of different portions of the drawing, this option allows you to plot one of those named views.
Once you have decided on what you will plot, you then have to tell the program how to plot it.
The following dialogue box will come up on screen and allow you to configure it as required.
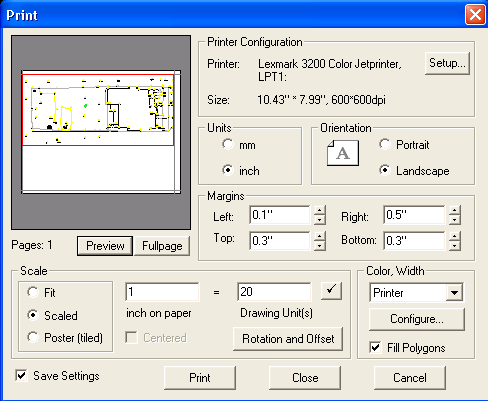
Being there are so many options, we will break the dialogue up in the following subsections and examine each one.
1) Printer Configuration
This option tells you which plotter or printer is currently selected and will receive the plot. It also tells you the size of the plotted area that you can plot into. This is smaller than the actual paper size in most cases due to the plotter margins.

To change to a different plotter you can pick on the SETUP button above. It will bring up the Windows Printer Setup dialogue (below) where you can select from the list of plotters/printers that are configured in your computer. You can modify the properties of the plotter, if required, pick the paper size and the orientation of the paper before picking OK to return.
Older Pen plotters may require you to setup the pens to match them with the correct color in your diagram and the carousel location in the plotter to ensure you get the correct width of pen for each line. If this is the case then you would do this via the Properties button.
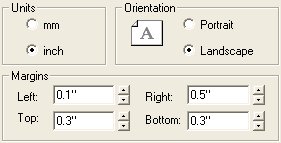
2) Units, Orientation and Margins
Be sure to have the correct units selected to match your drawing. Metric drawings will use mm and Imperial drawings use inch. You can select the orientation of the paper to ensure the paper and plot are going the same way to best use the paper. The Margins are set by the Windows plotter driver to allow you the largest plotting area available for the plotter selected. You can decrease the plotting area by increasing the margins if desired. You can not decrease the margins as the plotter driver has set them to the minimum for your plotter.
3) Scale
There are 3 ways to tell the plotter to scale the drawing.
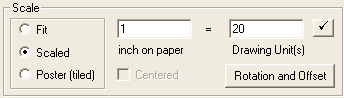
FIT:This will automatically scale the drawing so the entire plot will fit on the paper size and orientation shown. The drawing will be scaled but we will not know what the scale was set to. This is an easy way to simply make it fit to the paper chosen as long as you don't care what the actual scale is.
SCALED:We are being specific about how the plot will be scaled. To the right of the Scaled button you see two white boxes. If you are working in Imperial then you set the scale by typing 1 in the first box and the desired scale in the second box. The example above will plot at 1"=20'. The second number would be 50 if you required 1"=50' at the scale. If you were working in metric then this is slightly different. The first box is still set to 1 but the second box is set to 1 if the scale was 1:1000. If you required a scale of 1:250 then the second box would be set to 0.25. There is a factor of 1000 build in due to the fact that we used meters as our base units, and the program used with mm. This does not hurt anything and is done behind the scenes.
POSTER:Poster can be used when the potted drawing is too large for one piece of paper and you wish to have it plot to several pieces so you can match them and tape them together. The scale is still set in the same method as in SCALED above.
If you do a change to the scale, hit the little check mark to the right to update the size and location of the red box in the Preview window.
The Rotation and Offset button allows you to rotate the plot on the paper to best fit the orientation. In Poster Mode only the X and Y shift can also be done to move the postered drawing to best fit the number of sheets required to plot it out.
4) Color, Width
One of the more important options you have is found under the Color, Width portion of the dialogue box. You can configure the pen settings for each plotter/printer you have available by picking on one of the configurations, as shown in the second window below, and then picking on the Configure button as shown in the first window below.
 ‚
‚  ‚
‚
This will take you to the Configuration Color, Width dialogue box shown below
The Fill Polygons option will color in a polyline if it has a width assigned to it. If not checked on then it will simply draw the outline of the polyline.

Starting in the top right - the configuration name of this plotter can be set so that you can save it and have the ability to recall it when required. You can have up to 8 different plotters. Once set and the save button is checked, when you go to choose the configuration (as was done in the second dialogue in this section above), you will see the options as shown below.
In the top left of the Configurations dialogue above, the Circle Segments can be set from 8 to 1024. The higher the number then smoother the curves with be drawn. Pen plotters may require a lower number so the pen does not draw an excess of vectors and place too much ink on the paper. All others should be set to 1024.‚ Below this, be sure to check on the Line Width Settings if you require your drawing to be plotted using different widths of pens. Turn the color option on if you wish to have a color plot on paper or if you are using a pen plotter that requires the colors to be passed through to it's windows drive to set the pen widths internally. If you are using an inkjet plotter that can plot to color then turn this option on, leave it off if you want black and white plots.
In the bottom left corner there are 3 columns of information. In the example above it shows RED RED 0.010 in the first line. The first RED is the color use din the drawing, the second RED is the color it will plot with if you are plotting in color, and the 0.010 is the width of the pen used to draw the lines. If you are plotting in black and white then the second RED can be ignored. Set each color used in the drawing to plot with the width of pen desired (for pen plotters this is done in the plotter driver and not here).
To change the width of pen, pick on the color to change, then to the right under Linewidth, set the width to plot on paper and pick Change. The table to the left will update accordingly. Do this for each color that needs a width assigned. The same thing can be done for colors if you wish to plot in color. Any color in the first column can be set to actually plot in another color of your choice by setting the Printed Color option.
Once you have set every color used in the drawing to the appropriate line width and/or color, these settings will be saved in the configuration set above for future use.
Pick on OK to return.
5) Preview
The last thing to check is your preview to ensure the plot will fit on the paper size chosen, that the line widths are correct and colors are set correctly if plotting in color. The preview button will show a quick view of the drawing in the small window as shown below. The RED rectangle is the size of the drawing at the scale and settings chosen. The black lines around the 4 edges show the margins where the drawing will be placed within. The white represents the paper size which will be larger than the plotting area allowed by the margins. The drawing will be shown within the red rectangle. If the drawing does not completely fit inside the red rectangle then you may have to change one or more of the following: Paper size, Scale, Orientation, or Rotation.
The Fullpage button will draw the preview on the full screen making it easier to look at and determine if it is correct for what you desire. If you do change the Scale option then keep in mind that the drawing scale you started the drawing with may not match the plotting scale and some things like text and symbols may not be the correct size. The drawing scale and plotting scale should be the same if possible.

Now that you have confirmed and set everything, ensure the Save Settings check is on in the bottom left of the Print dialogue box. This will save all the setting so the next time you come in the settings will default as they are now allowing you to quickly do minor changes and then continue.
Last step- hit the PRINT button in the bottom center and sit back and watch the plot come out on your printer/plotter.
Created on: November 25, 1999
Jason Poitras
Comments